About the project
The RentalCal Tool
The RentalCal Profitability Calculation tool is a wide-ranging, straightforward tool providing an open and objective comparison of the retrofit opportunities available to investors in the residential rental market. The tool adopt established methodologies and valid input parameters to evaluate various energy retrofits and costs of such investment opportunities.
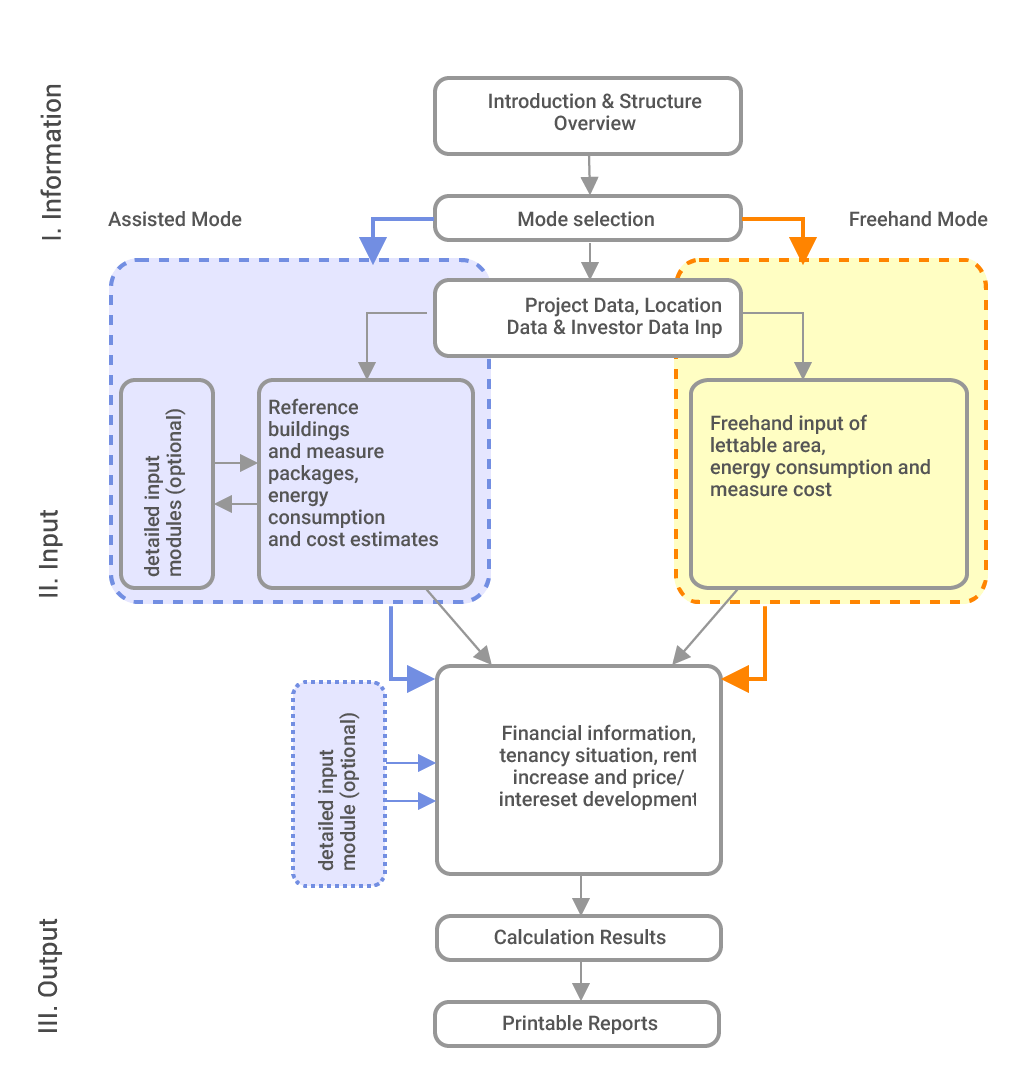
The RentalCal Tool consists of three parts:
- In the first part, the basic information to understand and apply the tool is provided to the user. This includes a comprehensive presentation and a video tutorial.
- In the second step, the necessary input data for the profitability calculation is requested from the user.
- For the third step (output data), the tool calculates the profitability of the investment in question and displays the results to the user. This also include a feature enabling sensitivity and probability analyses of the relationships between the input dassta and the output data.
Launch the Tool
Assisted Mode*
Profitability Calculation for a selected reference building and a selection of default bundles of measures from TABULA and the RentalCal databases. Default values for energy consumption, average cost figures for measures and energy savings are provided by the tool, which might be overwritten by the user if more accurate information is available. Moreover, the RentalCal consortium has worked out estimations for measure costs which are provided as suggestion values. This option is especially suitable for users who do not have a specific building in mind, but would like to gain a general insight into the profitability of energy efficiency retrofit in rental housing within different building types, ages and measures across the eight European countries. This option is intended for landlords who want to perform a profitability calculation for a specific building which does not come close enough to the offered reference buildings and who do not have obtained a complete energy concept (current consumption, bundle of measures and expected savings) yet.
*Note: Version 2 is currently WIP (Note: currently only the german case is available).
Freehand Mode*
Profitability Calculation for an own energy concept without any default values for energy consumption and savings, investment cost or suggestions on the right bundle of measures. If the required input data are available, this option is faster and more precise. It is especially intended for energy consultants, civil engineers, architects, owner’s associations and other building professionals who know the technical details and potential costs of the retrofit and want to perform a quick profitability calculation. Moreover, landlords who are consulted by these groups may also use this option.
*Note: Version 1 of the Webtool.
User Manual
The User manual is available in English and German. Click the image to view the corresponding PDF.

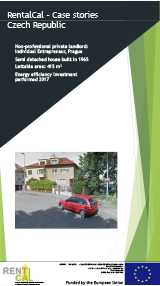
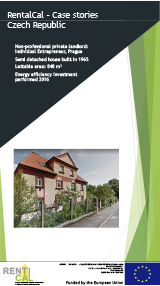
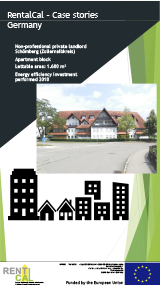
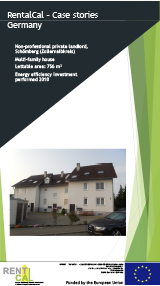
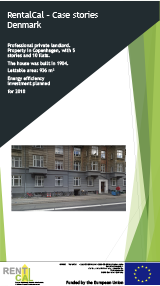
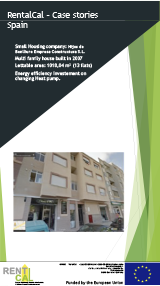
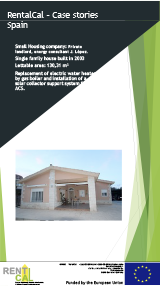
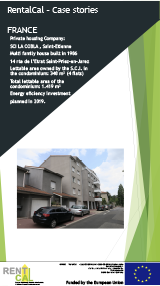
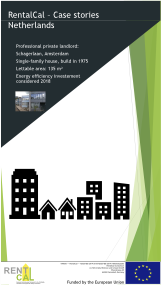
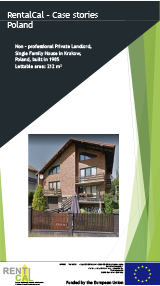
Case Stories
To give an impression of the results, one can achieve from using the RentalCal tool, we have gathered a number of case stories (Freehand Mode).


Video Tutorial
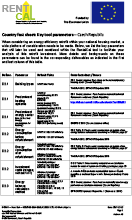
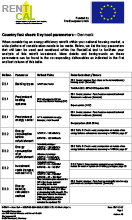
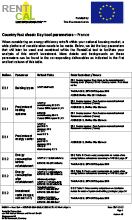
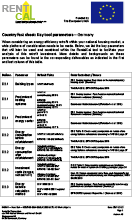
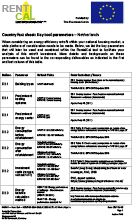
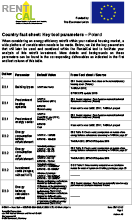
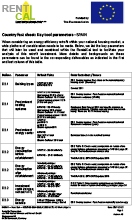
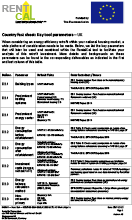
Tool Parameters
It is important to find the necessary information, before you start the tool - this makes the process much easier. You can find the necessary information in the illustrations in the manual.
The webtool is available in seven different languages. You choose the language in the upper, left corner of the tool.
As a result of using the RentalCal tool, you get a number of KPI's - Key Performance Indicators on rentability of investments. But the tool not only deals with the calculation of economic efficiency from investors and tenants perspective, it also analyses the consumption of energy and resources.
Contact Info
- RentalCal Consortium
- c/o IWU
- Institut Wohnen und Umwelt GmbH
- Rheinstrasse 65
- D-64295 Darmstadt
- Germany
- www.iwu.de »
Disclaimer
The sole responsibility for the content of this webpage lies with the authors. It does not necessarily reflect the opinion of the European Union. Neither the EASME nor the European Commission are responsible for any use that may be made of the information contained therein.

The project is funded by the European Union